Making WRF model output Xarray-friendly using xWRF
Friday, October 28th, 2022 (over 3 years ago)
![]()
Summary#
The WRF model is widely used in the atmospheric sciences community, but its raw NetCDF output is difficult to work with in Xarray. xWRF introduces post-processing and other utilities (via accessors), making an xarray.Dataset of analysis-ready WRF data just a line of code away:
1import xarray as xr 2import xwrf 3 4ds = xr.open_dataset("wrfout_d01.nc").xwrf.postprocess() 5
WRF in the Python Ecosystem#
The Weather Research and Forecasting model ("WRF") is a widely-used numerical weather prediction system, with applications in both atmospheric sciences research and forecasting on scales from climate prediction, to mesoscale weather forecasting, all the way to large-eddy simulations. For example, the National Centers for Environmental Prediction in the U.S. runs several models based on the WRF core (e.g., NAM and HRRR).
However, when using WRF in one's own research, WRF outputs NetCDF files that are not analysis-ready, but instead
- have vertical coordinates that are numerically-friendly, rather than physically useful,
- lack metadata conforming to community standards around which toolkits are built, and
- lack horizontal coordinates in projection space, preventing several types of geospatial calculations.
To address these needs, post-processing tools are most often used to translate the "raw" WRF output into something more useable. Previously in the Python ecosystem, the only extant package for doing so was NCAR's wrf-python. This legacy toolkit is built on long-standing Fortran routines ported from NCL, and has a rich set of functionality for extracting diagnostic variables and interpolating to physically-meaningful coordinate systems. However, it crucially lacks CF metadata handling and Dask support, making it difficult to integrate into the modern stack of Python tools in the Pangeo ecosystem or to scale up to larger datasets.
These factors, along with the maintenance burden of wrf-python's legacy framework, motivated several community members to build xWRF. Efforts started with a simple interface for processing just WRF's poorly constructed time coordinate(s), as showcased in the NCAR-ESDS blog in October 2021. Since then, xWRF has built up to a full-featured accessor-based interface that enables a seamless integration of the unique WRF output format into Xarray and the rest of the Pangeo software stack. Key features include:
- transforming WRF data into CF- and COMODO-compliant
xarray.Datasetinstances - converting WRF units into
pint-friendly ones - generating projection coordinates and providing a
pyproj.CRSobject - interpolating "staggered grid" fields to grid-cell centers (i.e., "destaggering")
In this post, we will show how xWRF works together with other utilities in order to post-process a large WRF dataset.
Installing xWRF#
Before we start using xWRF, we need to install it. We can do this by following these steps!
- Install it in your environment using either
- Open up a notebook and use the imports shown below!
1# for WRF data processing (`xwrf` Dataset and DataArray accessor) 2import xarray as xr 3import xwrf 4# for unit conversion (`pint` DataArray accessor) 5import pint_xarray 6# for `dask`-accelerated computation 7from distributed import LocalCluster, Client 8# for numerics 9import numpy as np 10# for visualization 11import holoviews as hv 12import hvplot 13import hvplot.xarray 14 15hv.extension('bokeh') # set plotting backend 16xr.set_options(display_style="text") 17
Spin up a Cluster#
This example uses a large volume of data, so in order to make use of Dask's parallelized computational speedup, specifying a Dask cluster best suited for the computational resources at one's disposal is in order. Here, we use a LocalCluster to parallelize within a single machine. If we had access to a HPC system, we could also use Dask-Jobqueue or another distributed Dask configuration in order to outsource the computation there.
1cluster = LocalCluster(n_workers=6) 2client = Client(cluster) 3print(client) 4
<Client: 'tcp://127.0.0.1:33017' processes=6 threads=24, memory=125.71 GiB>
Example analysis#
In this example, we will have a closer look at some WRF output data generated by downscaling the CMIP6 GCM data to higher spatial resolutions. The Coupled Model Intercomparison Project phase 6 (CMIP6) provides scientific input to the 6th assessment report of the IPCC (IPCC AR6). There, the CMIP-models are used to analyze the impact of different forcings on the climate system and predict future climate change given different scenarios.
For the purposes of our example, let's imagine that one wishes to investigate how climate change could affect the jet stream in the California region in different climate change scenarios. In earlier IPCC reports, said scenarios would only be differentiated by different Representative Concentration Pathways (RCP), modeling different radiative forcings due to greenhouse gases, aerosols and other factors. However, one major critique of this framework was that it excluded a whole dimension of socioeconomic and political developments. Since AR5, this dimension is included using so-called Shared Socioeconomic Pathways (SSP). For the sake of this analysis. we pick two different scenarios which one might want to compare, namely SSP2-4.5 (SSP2, 4.5 W/m^2 forcing in 2100) and SSP5-8.5 (SSP5, 8.5 W/m^2 forcing in 2100).
In order to be able to easily access this data, we are using an intake catalog. This catalog points to kerchunk metadata which in turn points to an Open Data AWS bucket. This allows us to read a large multi-file collection of NetCDF files as if they were a single Zarr store concatenated over time (and this indeed uses an xr.open_dataset call with the zarr engine behind the scenes).
1import intake 2cat = intake.open_catalog("https://raw.githubusercontent.com/xarray-contrib/xwrf-data/main/catalogs/catalog.yml") 3ssp5_ds = cat["xwrf-sample-ssp585"].to_dask() 4ssp5_ds 5
As one can see, this output is not very helpful. Heaps of necessary information like WRF model grid coordinates or coordinate index assignments are missing. But we can use xWRF to very efficiently fix this.
1import time 2 3start = time.time() 4ssp5_ds = ssp5_ds.xwrf.postprocess() 5end = time.time() 6 7print(f"{end - start} s elapsed") 8ssp5_ds 9
3.1846201419830322 s elapsed
Despite the uncompressed dataset being close to 60GB in size, the xWRF post-processing is done in negligible time thanks to delayed computation of dask arrays.
Along with cleaning up the coordinates, xWRF post-processing includes the calculation of some basic diagnostics not included in WRF output, namely air_pressure, air_potential_temperature, geopotential and geopotential_height. Since version 0.0.2, it also computes wind_east and wind_north - earth relative wind vector components. These exist as dask arrays with delayed execution, and so are only computed upon using .compute(), .persist() or .values on the variable itself or a variable depending on it.
1ssp5_ds.air_pressure 2
For comparison with these SSP5-8.5 data, using method chaining, we can load the SSP2-4.5 data too and post-process it in a single line!
1ssp2_ds = cat["xwrf-sample-ssp245"].to_dask().xwrf.postprocess() 2ssp2_ds 3
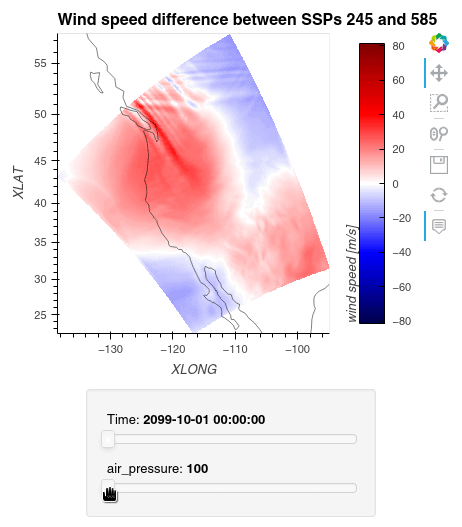
Now, say we want to calculate the wind speeds from grid-relative wind vector components using MetPy. Because WRF's most commonly used core utilizes a numerically-advantageous Arakawa-C grid, these wind components are located on grid cell walls and have differing array shapes, which means we need to destagger them onto the grid cell center to perform our calculation (we could also use the already-destaggered earth-relative wind component, but where would be the fun in that? ;) ). Additionally, atmospheric data is most frequently interpreted on isobaric (constant pressure) levels, so we also will use xgcm to perform vertical interpolation to our defined pressure levels.
1from metpy.calc import wind_speed 2import xgcm 3 4plevs = np.array([350., 300., 250., 200., 150., 100.]) # in hPa 5wind_speeds_js = [] 6 7for ds in [ssp2_ds, ssp5_ds]: 8 for field in ['U', 'V']: 9 ds[field] = ds[field].xwrf.destagger().variable 10 ds = ds.metpy.quantify() 11 _wind_speed = wind_speed(ds.U, ds.V).metpy.dequantify() 12 grid = xgcm.Grid(ds, periodic=False) 13 _wind_speed = grid.transform( 14 _wind_speed, 15 'Z', 16 plevs, 17 target_data=ds.air_pressure.metpy.unit_array.m_as('hPa'), 18 method='log' 19 ).persist() 20 wind_speeds_js.append(_wind_speed) 21
Now, we can simply subtract the wind speed data of the two simulations from one another, let Dask compute the outcome, and plot the data using hvplot.quadmesh.
1ws_difference = (wind_speeds_js[0] - wind_speeds_js[1]).compute() 2max_value = np.max(np.fabs(ws_difference)).item() 3 4plot = ws_difference.hvplot.quadmesh( 5 x='XLONG', 6 y='XLAT', 7 groupby=['Time', 'air_pressure'], 8 widget_location='bottom', 9 title='Wind speed difference between SSPs 245 and 585', 10 cmap='seismic', 11 clim=(-max_value,max_value), 12 clabel='wind speed [m/s]', 13 coastline=True, 14 geo=True, 15 rasterize=True, 16 project=True 17) 18plot 19
Finally, we clean up our workspace.
1ssp5_ds.close() 2ssp2_ds.close() 3cluster.close() 4client.close() 5
Conclusions#
In this blog post, we demonstrated how xWRF can handle the eccentricities of WRF model output in a lightweight and efficient fashion so as to integrate seamlessly with Xarray and many other tools of the Pangeo stack like Dask, MetPy, and xgcm. This updated approach, in comparison to legacy WRF post-processing tools, handles large, cloud-based workflows effortlessly as seen with this downscaled CMIP6 example. Single local-file use cases are just as straightforward, as seen in xWRF's documentation (among several other examples).
The latest version of xwrf (v0.0.2, as of publication) contains the core set of functionality needed for most WRF postprocessing and is available on both conda-forge and PyPI, so feel free to try it out with your own WRF data processing! As a rather new package, we especially welcome any bug reports or feature requests on xWRF's issue tracker, as well as PRs for code and/or documentation contributions.