Xarray
N-D labeled arrays and datasets in Python
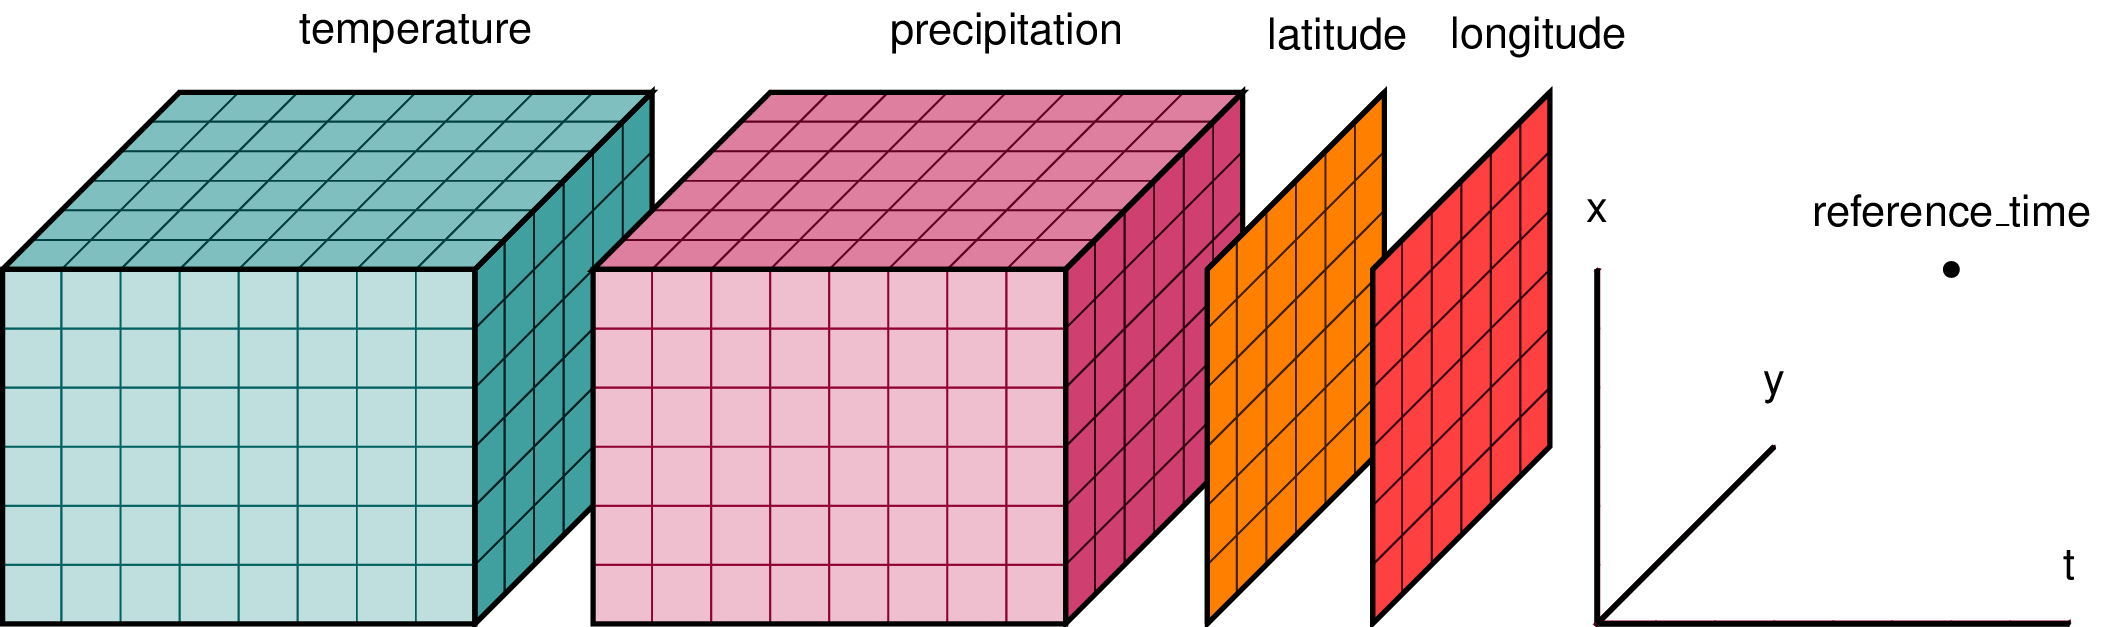
Xarray is an open source project and Python package that introduces labels in the form of dimensions, coordinates, and attributes on top of raw NumPy-like arrays, which allows for more intuitive, more concise, and less error-prone user experience.
Xarray includes a large and growing library of domain-agnostic functions for advanced analytics and visualization with these data structures.
Key Features & Capabilities
Xarray provides data models for working with labeled arrays and datasets. Its toolkit includes a broad set of domain-agnostic functions for advanced analytics and visualization with these data structures.
Interoperability
Interoperable with the scientific Python ecosystem including NumPy, Dask, Pandas, and Matplotlib.
Apply operations over named dimensions
Select values by label instead of integer location
Vectorized operations
Mathematical operations vectorize across multiple dimensions (array broadcasting) based on dimension names, not shape.
GroupBy operations
Flexible split-apply-combine operations with groupby.
Database like operations
Database like alignment based on coordinate labels that smoothly handles missing values.
Arbitrary metadata tracking
Keep track of arbitrary metadata in the form of a Python dictionary.
Flexible and Extensible I/O backend API
Read and write data to and from NetCDF, HDF, Zarr, OpenDAP, and GRIB.
Try Xarray
Try Xarray in a REPL directly in your browser (no installation needed)!
1"""
2To try Xarray in the browser,
3use the console located 👉 or 👇:
41. Type code in the input cell and press
5   Shift + Enter to execute
62. Or copy paste the code, and click on
7   the "Run" ▶ button in the toolbar
8"""
9import xarray as xr
10import pandas as pd
11import numpy as np
12
13data = xr.DataArray(
14    np.random.randn(3, 2, 3),
15    dims=("time", "lat", "lon"),
16    coords={
17        "lat": [10, 20],
18        "time": pd.date_range(
19            "2020-01", periods=3, freq="MS"
20        ),
21    },
22)
23
24# positional and by integer label, like numpy
25data[0, :]
26
27# loc or "location": positional and
28# coordinate label, like pandas
29data.loc[:, 10]
30
31# isel or "integer select": by dimension name
32# and integer label
33data.isel(lat=0)
34
35# sel or "select": by dimension name and
36# coordinate label
37data.sel(time="2020-01")
38
39# Data aggregations uses dimension names
40# instead of axis numbers
41data.mean(dim=["time", "lat"])
42
43# quick and convenient visualizations
44data.isel(lon=0).plot();
45
46# Pretty neat, eh? :)
47# For more, head over to the documentation pageEcosystem
Xarray is part of the larger scientific Python ecosystem. It is built on top of NumPy, Pandas, and Dask and supports a wide range of domain specific scientific applications.


Xarray supports multiple array backends, allowing users to choose array types that work best for their application.
NumPy
NumPy is the fundamental package for array computing with Python.

Dask
Distributed arrays and advanced parallelism for analytics, enabling performance at scale.
CuPy
NumPy-compatible array library for GPU-accelerated computing with Python.

Zarr
An implementation of chunked, compressed, N-dimensional arrays for Python.
Sparse
Sparse multi-dimensional arrays for the PyData ecosystem
Supported By
We thank these institutions for generously supporting the development and maintenance of Xarray.


Donate
Xarray is a NumFOCUS Sponsored Project, a 501(c)(3) nonprofit charity in the United States. NumFOCUS provides Xarray with fiscal, legal,
and administrative support to help ensure the health and
sustainability of the project. For more information, visit numfocus.org
If you like Xarray and want to support our mission, please consider making a donation to support our efforts.